Libelium stations
Introduction
Libelium is a spanish company specialized in the development and manufacture of sensory devices.
One of its flagship products is the Waspmote plug & play, a sensor box with wireless connectivity that allows you to connect up to 6 probes to measure temperature, humidity, pressure, pollution, noise and many other atmospheric data.
Sentilo is a sensor/actuator platform developed by the Barcelona Council and adopted by many cities in Catalonia. This platform provides a simple HTTP REST API to publish and read the sensory data without dealing with the complexity and heterogeneity of the devices.
The Waspmote can be easily programmed in C++ (in a similar way to Arduino boards) to send the data of the probes to the Sentilo platform through a Wifi connection.
In this project we will see how to create a Brain4it module with a dashboard to visualize the sensory data provided by 4 Libelium stations (Waspmote plug & play) integrated in Sentilo.
Programming the module
Each Libelium station publishes a new observation of its sensors in Sentilo every 2 minutes. The name of these sensors follows this convention:
libelium_<station>_<sensor_type>Examples: libelium_MAG_tem, libelium_MAG_pre, libelium_ROS_tem, libelium_ROS_hum, etc.
On start, the Brain4it module creates a subscription to the sensors of the 4 Libelium stations. This is done by calling the function subscribe_sensor for each station and sensor type in the start code block:
(for-each
  ("MAG" "ROS" "BRI" "PLA")
  libelium_station
  (for-each ("tem" "pre" "hum") sensor_type
    (subscribe-sensor libelium_station sensor_type)
  )
)
Where the subscribe_sensor function is:
(function (libelium_station sensor_type)
  (http
    "PUT"
    (concat
      setup/sentilo_url
      "/subscribe/data/"
      setup/provider_id
      "/libelium_"
      libelium_station
      "_"
      sensor_type
    )
    "properties" =>
    (list "IDENTITY_KEY" => setup/provider_key)
    "body" => (list "endpoint" => setup/callback)
    "input-format" => "json"
    "output-format" => "json"
  )
)
After that, whenever a station publishes a new data for a sensor, Sentilo will invoke the @callback exterior function:
(function (context data)
  (local
    info
    sensor
    station
    sensor_type
    sensor_value
    last_value
    timestamp
    history_values
  )
  (set info (parse data "json"))
  (set sensor (split info/sensor "_"))
  (set station sensor/1)
  (set sensor_type sensor/2)
  (set sensor_value (number info/message))
  (set timestamp info/time)
  (### "save last value to history_data")
  (if (not (has history_data sensor_type))
    (put history_data sensor_type (list))
  )
  (if
    (not
      (has (get history_data sensor_type) station)
    )
    (put
      (get history_data sensor_type)
      station
      (list)
    )
  )
  (set history_values
    (get (get history_data sensor_type) station)
  )
  (set last_value
    (get (get current_data sensor_type) station)
  )
  (if last_value
    (do
      (push history_values last_value)
      (### "remove oldest value if necessary")
      (if (> (size history_values) 1000)
        (remove history_values 0)
      )
    )
  )
  (### "save current value to current_data")
  (if (not (has current_data sensor_type))
    (put current_data sensor_type (list))
  )
  (put
    (get current_data sensor_type)
    station
    (list sensor_value timestamp)
  )
  (module-notify (concat "@get-" sensor_type))
  (module-notify
    (concat "@get-" sensor_type "-history")
  )
)
This function reads the sensor data and save it in two global lists:
- current_data: a list that contains the current data for each sensor type and station.
- history_data: a list that contains the historic data for each sensor type and station.
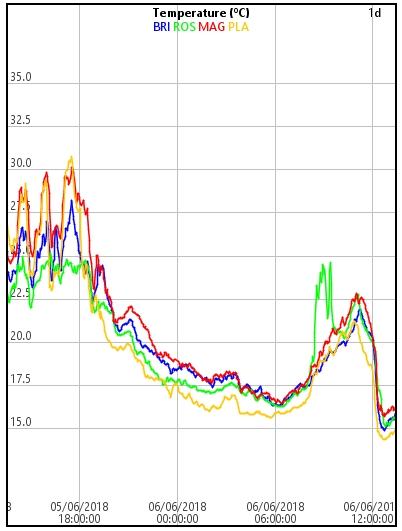
These lists are read by the graph widget of the dashboards of this module to plot the sensor values:
